 |
 |
 |
|
 |
 |
 |
 |
 |
 |
 |
 |
 |
 |
 |
 |
|


 Politics and more Politics
 Go | New | Find | Notify | Tools | Reply |
| Destroying the Church of Global Warming | Login/Join |
| DRR Sportsman |
just checked my email i found a solar industry lobyist. i'm never afraid to admit when i'm wrong but lets see how much did they spend as compared to the coal industry? wow! like i said follow the money! k-street must die!This message has been edited. Last edited by: Dan Lee Watson, | |||
|
| DRR Elite |
Now we have an American Legion Post in Vegas that installed a $383,000.00 solar system that they claim will save a whopping $130,000.00 in 10 years? What a ROI! How much of that system will have to be replaced by the time 10 years is up? AND, are the $130,000.00 in savings predicated on the utility prices now or the quadrupled prices "dyck obama bin lyin'" has stated his programs will cause? TAKE IT TO THE BANK!!!!! Later, Bill Koski | |||
|
| DRR Top Comp |
Because the "pro warming lobbyist" are already inside the government... handing out billions of taxpayer dollars to any scientist with a research project or "green" company that fits into their agenda. DOE's guaranteed loan program ring a bell!? Or here's one most have never heard about... the Federal Government's Department of Science was dolling about $160 billion in government research grants in 2009 to anyone that was on board with the man-made global warming narrative. ***** about K Street all you want! It doesn't stand a chance against the infiltration of the Federal Agencies and Departments by the environmentalist nazis. Greg Stanley Off the grid and off my rocker!  | |||
|
| DRR Elite |
That's just silly. I do a bit of consulting for a alternative energy company, and they say they normally walk away from a project that doesn't have a 10 year payback or better. They walk away from many projects. Foxtrot Juliet Bravo | |||
|
| DRR Pro |
What, changing the subject now? I thought we were discussing how the feds were breaking there own rules for recording temperatures and how accurate those temperature records are? That seems to be what you were on about. Mike Wrote: "Why is it that less than 10% of the places where the federal goverment monitors the temps dont meet their standards." "The federal goverment doesnt even follow their own standards for recording the tempature." By the way you seem to have forgotten to post a link to where the specific rules are that you are saying the feds (or whoever) are breaking are located. Mike Wrote: "Climate will continue to change. In by 2015 we should be in a cooling trend." Oh, and how about some links to any research that says we should be cooling by 2015, and how long this cooling trend might be. How about you start trying to answer some of my questions for a change. Later Larry Sapere aude! "Put some jam on the bottom shelf where the little man can reach it." "The Truth", it's just another liberal conspiracy! | |||
|
| DRR Elite |
larry wrote, a pile of BULL SHYT!!!!!!!!!!!!!!!!!!!!!!!!! TAKE IT TO THE BANK!!!!! Later, Bill Koski | |||
|
| DRR Pro |
I think a more appropriate question might be, are YOU kidding? Apparently you don't have a grasp of the fundamentals of statistics in general and a simple linear regression in particular. In absolute terms over the range of years we see about a one degree maximum spread in temperatures. Next there is no "stretch" about it; it is the application of relatively simple mathematics, no guess work here. The point I was trying to make to Mike with the graph is that the two methods of gathering surface temperatures both ground and satellite agree very well. Both the individual data points and the linear regressions are all in close agreement. Mike was apparently trying to say that they are not. The apparent large differences, they really aren't all that big in absolute terms, between some adjacent years is called weather, the slope of the three linear regression lines depict climate change over the time span, in this case the average temperature is trending up by about 0.4 degrees Celsius over the span of the regression. That IS the whole point of using linear regression in many cases, to be able to see trends in noisy data. Go here for a primer on linear regression http://en.wikipedia.org/wiki/Linear_regression Ok to your second question, open the PDF below and look at the top of the third page. You will see graphs that represent a number of climate model ensembles. They show the predicted temperature increase, the black line is what the same climate models give if no CO2 forcing is used. The run date of these models was 2001 they predicted about 0.6 to 0.8 C for our current date, we got 0.4 to 0.5 MEASURED temperature increase go back and look at the other graph I posted previously again. It is showing pretty well how much increase is do to human activity. So no if we and our industrial activities were not here we would not be seeing the same trend. Isn't it pretty darn obvious that the predictions from 10 years ago said temp increases and low and behold 10 years later we have pretty close to what they predicted. You still waiting for god to tap you on your shoulder and whisper it in your ear? http://www.cgd.ucar.edu/ccr/publications/dai_bau.pdf Later Larry Sapere aude! "Put some jam on the bottom shelf where the little man can reach it." "The Truth", it's just another liberal conspiracy! | |||
|
| DRR Elite |
Cooling Trend Continues The overall global temperature has been gradually decreasing since 1998, which was the warmest year since the end of the Little Ice Age a little more than 100 years ago. If the Keenlyside study is correct, the ongoing cooling will have lasted for roughly 20 years by the time it ends. Global temperatures also cooled between 1945 and 1977, a period of 30 years. Thus Keenlyside's study indicates cooling temperatures will have dominated 50 of the 70 years since 1945, once the current cooling trend comes to an end. Scientists have known for some time currents in the North Atlantic move warm water north and carry cooled water south, but they do so in fluctuations. The mechanisms driving this circulation, particularly the subsurface ones, are still poorly understood, the report pointed out. Computer Model Questioned Although the influence of ocean currents on the climate is a promising field of research, the Nature study may amount to less than meets the eye, some analysts say. Far from breaking new ground, the study is yet another computer-model-driven exercise, which skeptics consider to be of questionable scientific value. "It looks like all the authors did was look at predicted temperature changes over a smaller time scale--one decade--without questioning, undermining, or changing any of the basic relationships between greenhouse gas concentrations and average global temperatures used to support anthropogenic activities as the overriding force behind global warming," said David Lewis, director of the Georgia-Oklahoma Center for Environmental Research and visiting scientist with the Department of Marine Sciences at the University of Georgia. "The study is just saying that ocean currents over the next decade are not going to move as much heat away from the equator," Lewis added. "That's not the same as saying that not as much heat will be trapped in the oceans and the atmosphere as predicted by the greenhouse gas effect--which would mean that some other mechanism is more important." -------------------------------------------------------------------------------- L8R, Mike | |||
|
| DRR Pro |
Mike are you congenitally unable to provide the links to where you are quote mining from? Why is that Mike, your sources not quite the type of sources you want to own to? So here is where I suppose you got your quote mines from, an article by Bonner Cohen writing in the heartlander, written in August of 2008. Another sterling example of what you no doubt see as fare and balanced reportage. But it is not science is it, just another right leaning misrepresentation of a paper that the author, Cohen, believes supports his preconceived notions and you swallow whole with nary a though of fact checking any of it. http://news.heartland.org/news...ing-ahead-study-says In the whole article by Cohen we see this "Their study, "Advancing Decadal-Scale Climate Prediction in the North Atlantic Sector," appeared in the April 30 issue of Nature.” which is the article by Keenlyside which Cohen is using to add authority to his statements. Another thing I noticed is that you very likely didn't read the article by Keenlyside, I know this because the link to it in the Cohen piece is busted. So just in case you might like to read the article upon which your quote mines in the Cohen piece are supposedly based, here is a link to it, ftp://ftp.soest.hawaii.edu/coa...Global%20cooling.pdf So all this aside lets start with your first quote mine. "The overall global temperature has been gradually decreasing since 1998, which was the warmest year since the end of the Little Ice Age a little more than 100 years ago. If the Keenlyside study is correct, the ongoing cooling will have lasted for roughly 20 years by the time it ends. Global temperatures also cooled between 1945 and 1977, a period of 30 years." The first sentence is technically correct "only" if one chooses the 1998 high outlier as the initial starting point for a decadal linear regression as implied in the title of Keenlyside's article and would come under the heading of "figures don't lie, but liars can figure". Once again to the graph I provided earlier in the thread. 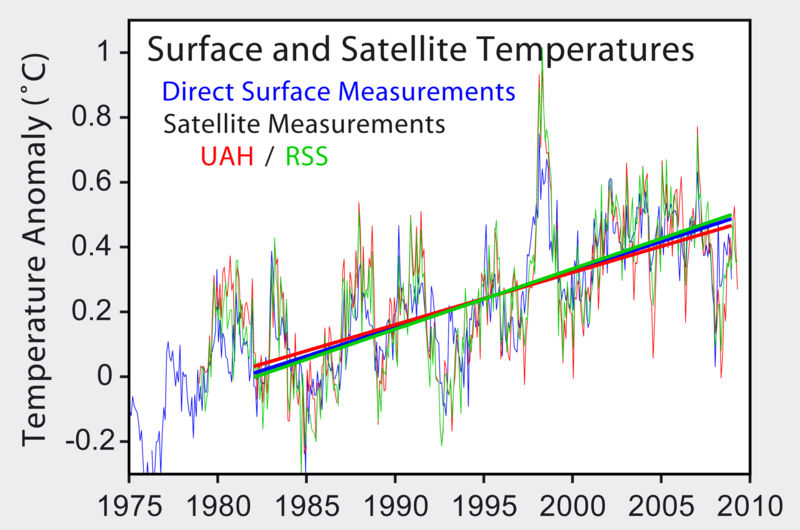 By selecting a suitably short time period and certain initial starting points one can claim all the warming or cooling trends one wants, throughout the temperature record, but that would be a bit disingenuous, wouldn't it mike? That is exactly what Cohen has done in his piece and added a bit of window dressing by implying that the Keenlyside paper is supporting the statements he made. So what has Keenlyside actually said, he has in essence said that natural decadal variations in SST's (Sea Surface Temperatures) in the northern seas may cause a modest "lessening" of the expected near term increases, the overall or long term warming trend is likely to continue unabated and even increase after that. Further Keenlyside is interested in increasing the modeling accuracy for near term events, i.e. weather forecasting, quoting Keenlyside, "Experience in numerical weather prediction and seasonal forecasting has shown that skill can be considerably improved by reducing model systematic error and by more accurate forecast initialization." Thus the main thrust of his paper is the improvement of computer models to more accurately forecast "weather" by use of decadal variations in SST's, not specifically forecasting of long term trends, although he does, and those forecasts agree with the consensus of continued warming into the future. Please see his longer term forecast graph Fig 4 in the paper showing a projected temperature increase of 0.8 C by 2030. Next let's look at your quote mine, by Dr. Lewis saying, "It looks like all the authors (meaning Keenlyside et.al) did was look at predicted temperature changes over a smaller time scale--one decade--without questioning, undermining, or changing any of the basic relationships between greenhouse gas concentrations and average global temperatures used to support anthropogenic activities as the overriding force behind global warming, David Lewis, director of the Georgia-Oklahoma Center for Environmental Research and visiting scientist with the Department of Marine Sciences at the University of Georgia." Dr. Lewis has just said the same thing I did above, you have by choosing this quote shot yourself in the butt. Read the quote again, Dr. Lewis saying the Keenlyside paper means nothing with regard to Climate Change i.e. global warming and its primary causative agent anthropogeniclly generated greenhouse gases. Or even that we are cooling, a lessening of the rate of a warming trend is not a cooling trend with regard to climate change. Yes the affects of SST's can have a lessening effect on the overall trend of warming, over very short periods of time, a decade or 5 years, and may indeed show affects on the weather, which lessen the rate of long term increase. In the next quote you take square aim at the other cheek, and score another direct hit. Again this is Dr. Lewis talking about what the Keenlyside paper does and does not mean. "The study is just saying that ocean currents over the next decade are not going to move as much heat away from the equator," Lewis added. "That's not the same as saying that not as much heat will be trapped in the oceans and the atmosphere as predicted by the greenhouse gas effect--which would mean that some other mechanism is more important." Dr. Lewis is saying in the above quote that Keenlyside's paper does NOT support some other mechanism outside of greenhouse gases as the primary driving factor behind climate change. So we can now see where you have gotten your misconceptions and misinformation about cooling trends from. Finely here is the latest graphical representation, that I can find off hand, of the Seasonal Mean Temperature Change from 1950 forward along with an underlay of SST's indicating El Nino's and La Nina's. There is a clear and steady increase of average "global" (upper graph) temperatures from about 1965 on with no signs of a climatological significant cooling trend. But low and behold we see when sea surface temps go up and down do to circulation changes (El Nino and La Nina) we have seasonal peaks and valleys. Who would have thunk it. Now if you wish to select the time frame from 1998 to present and limit data to low latitudes (middle graph) and run a linear regression low and behold a cooling trend appears. But that is cheating right mike? It's not a global representation, its just a time limited regional one.  Here is another one for you Mike this time look at them northern latitudes (top graph), damn will you look at them average temps go up.  OK, how about northern hemisphere vs. southern hemisphere? Damn who would have suspected more warming in the northern hemisphere where most of the people and industry is located, but still all trending up even in the south.  Here is a link to the site where all the graphical information is located. http://data.giss.nasa.gov/gistemp/graphs/ Do also scroll down to the bottom of the page and click on "page 1" and "page 2" for more graphical temperature info from Colombia University. Oh, by the way you still seem to have forgotten to provide a link to the federal regulations regarding temperature collections that the feds are supposed to be breaking. Think you might find that for me? No, didn't think so. P.S. Please do forgive any misspellings and grammatical errors, as my proof reader Mr. Kosky doesn't seem to be around at the moment. Later Larry Sapere aude! "Put some jam on the bottom shelf where the little man can reach it." "The Truth", it's just another liberal conspiracy! | |||
|
| DRR Pro |
I am sorry Bucky I can't help myself, all I can say here is if that was my car, I'd be loading it on the trailer to take home and try to figure out what was broke and fix it. With a spread of almost a tenth and a half even if the wind was all over the place, statics isn't going to help that thing, only Lady Luck or bagging like heck could get that thing to with winners circle, or a solo class run for the win. Later Larry Sapere aude! "Put some jam on the bottom shelf where the little man can reach it." "The Truth", it's just another liberal conspiracy! | |||
|
| DRR Top Comp |
 Since this chart only goes to 2000, and we know there has been a surge of pirates in the last few years, this supports the indisputable fact that a cooling trend is inevitable. __ Michael Beard - staginglight@gmail.com Staging Light Graphic Design, Printing & Event Marketing | |||
|
| DRR Elite |
Sorry Larry but I have a life. I'll see if I can find time this weekend. like I said 4/10ths of a degree! L8R, Mike | |||
|
| DRR Elite |
Exactly my Point Larry! Thank you. The data is crap. You can use linear regression on crap data, but the line is then....crap. I'm fine with it if we can prove that the earth is warming. And that could very well have alarming concequences. But we have yet to draw a line between burning of fossil fuels and exactly how much impact it has on the warming of the earth. Foxtrot Juliet Bravo | |||
|
| DRR Pro |
Reductio ad absurdum Later Larry Sapere aude! "Put some jam on the bottom shelf where the little man can reach it." "The Truth", it's just another liberal conspiracy! | |||
|
| DRR Pro |
One of my points to you is no you shouldn't try to make a stastics analysis based on five ET data points alone, the results would be poor at best and misleading at worst. The bare minimum is about 30 data points. There are many guys at the track that have years of run data in there log books or computer databases. I kept stats on dozens of perimeters, not solely ET's. He11 based on the data we had in our computer we could go the track and not make, any, time runs and know +/- a hundredth what the car was going to run first round, cold. After that we knew within a few thousandths. Doing it that way didn't help the driving situation any, but we new pretty damn close what the car was going to do, that is what stats will do for you. We had a 7 LB bag of shot that was worth exactly +/- 0.004 sec that we used to tune and dial with. If the computer said the car was going to run say 9.451 we would put the bag in the car, if the bag was already in the car it would come out of the car. Do you have any idea what the term "sand bagging" originally meant? Now you do. The car was deadly consistent, the driver on the other hand, ahh not so much. The driver in our case was our own worst enemy; he simply could not and would not believe the car was going to do what I told him it was going to do. Based on the number of round losses one year, do to driver error, meaning Mark would not drive the damn car to the stripe without lifting because he just knew he was "on a lap" and was going to breakout; if we had those round losses back we would have won the track championship. By such a wide margin I have no doubt we would have had a bunch of people accusing us of using a Mattie (sp?) box. As it was we finished third. Just like you, Mark simply could not wrap his head around the idea that the stats I used to dial and the car itself were that reliable. All he had to do was get in the car and do the best he could on the tree, then drive the damn car to the other end of the track, period! If I had a sawbuck for every time I told Mark, "DONT THINK, just pull the trigger and drive it to the other end", I'd likely have enough money to still be racing, not to mention how much more money we would have won on top of that. The biggest variable in the car is the damn driver! Anyway the point is the larger the number of data points you have to work with, the more reliable the results become. We have around a hundred years of observational temperature data, alone, the quality and quantity of which just keeps getting better and larger as time goes by. Further we have many thousands of years of proxy temperature data. Not to mention all the other parameters scientist have accumulated that relate to this area of study. All this by people whose only job in life is to know and understand this one area of science. To follow the trackside analogy, if you were at the track and say Austin Coil told you something about Top Fuel tuning and a duck from the street staging lanes that had been to the track three times in his whole life disagreed with Coil, who would you believe? With regard to the science of climate change, you are a duck that doesn't want to believe what Austin Coil is telling you about tuning a Top Fuel dragster! For my part, I think I'll be listening to what Coil has to say; in just the same way, I'll listen to what science has to say on climate science. Later Larry Sapere aude! "Put some jam on the bottom shelf where the little man can reach it." "The Truth", it's just another liberal conspiracy! | |||
|
| DRR Elite |
Larry. Trust me I understand statistics. My statement is based on the graph, and how the data points in relation to the regression line slope. When there is that much spread, then it is difficult to trust a real sharp pencil for predicting the next point for sure. Foxtrot Juliet Bravo | |||
|
| DRR Elite |
Spain was the first nation to go whole hog whackado green. When the results came in they found that for every green job "created" it destroyed almost 3 "REAL" jobs! Now the nation is at 21.5% unemployment and just threw the socialists out of power! They may have waited too long! Without a doubt the epa in the U.S. has destroyed at least three jobs here for every bogus greenie position! TAKE IT TO THE BANK!!!!! Later, Bill Koski | |||
|
| DRR Elite |
Oh come on Bill. It's totally worth it for a problem we: a. Don't know we have b. Aren't sure of the causes, and how much each cause contributes to the problem. Foxtrot Juliet Bravo | |||
|
| DRR Elite |
The only people it's worth it to are people like the Solyndra operators, bobby kennedy jr and his $1,200,000,000.00 hand out and numerous other perpetrators of greenie boondoggle scams!!!!!!!!!!!!!!!!!!! How these duped boob IMBECILES can ignore the entire scam being exposed by the E-mails that were made public last year demonstrates for one and all why they are duped boob IMBECILES!!!!!!!!!!!!!!!!!!!!!! TAKE IT TO THE BANK!!!!! Later, Bill Koski | |||
|
| DRR Pro |
Greg: "Do some reading and ask yourself why just a few short years ago carbon monoxide (CO) was the "end all be all" of evil greenhouse gases. But then, all of the sudden, carbon dioxide (CO2) became the scourge of planet." Actually I did do some reading and Carbon Monoxide is not even considered as a green house gas. Maybe you should do some reading too. Oh by the way "they" have been claiming CO2 is one of the most problematic green house gasses for about 36 years. The seminal paper that started it all was published Aug 8, 1975 by Wallace S. Broecker Broecker Paper By the way Broecker predicted in 1975 we would have 403 ppm CO2 in 2010 we have about 390 ppm and about 1.1 degrees C increase in global average temps, if you look at the above graph we have about 0.6 measured increase, not too shabby for a first attempt at climate change prediction. Further, CO in tail pipe emissions was and is considered unhealthful. That is the reason we have catalytic converter on cars. It's not about GHG's it's about the fact very small amounts (35 ppm) of CO can make you sick and as little as about 650 ppm of CO can kill a person. CO has trended down by 82% from 1980 to 2010. Can you say catalytic converter? http://epa.gov/airtrends/carbon.html "Non-greenhouse gases Although contributing to many other physical and chemical reactions, the major atmospheric constituents, nitrogen (N2), oxygen (O2), and argon (Ar), are not greenhouse gases. This is because molecules containing two atoms of the same element such as N2 and O2 and monatomic molecules such as Ar have no net change in their dipole moment when they vibrate and hence are almost totally unaffected by infrared light. Although molecules containing two atoms of different elements such as carbon monoxide (CO) or hydrogen chloride (HCl) absorb IR, these molecules are short-lived in the atmosphere owing to their reactivity and solubility. Because they do not contribute significantly to the greenhouse effect, they are usually omitted when discussing greenhouse gases." http://en.wikipedia.org/wiki/Greenhouse_gas Greg: "See, I work in the field that has been a major propagator of the man made global warming narrative. And originally CO was the main focus because they wanted to target the internal combustion engine and the burning of fossil fuels as the "culprit". But when the science that was suppose to back up this narrative showed that the amount of CO in the atmosphere had not changed by any significant amount in the last 100+ years it shot their narrative all to hell." No, you don't work in the "field"; you're a Facilities (maintenance) manager for the JGI people (Joint Genome Institute) it appears the people in your building do genetics sequencing projects/research. That doesn't seem to get you in the know about global warming. Sounds like you are spinning yarns Greg. http://www.linkedin.com/pub/greg-stanley/35/b67/417 So provide some support for your suggestion that CO was ever a "be all end all" green house gas. Greg: "Enter CO2, the most abundant "green house" gas in the atmosphere. "That's the cause of global warming" they now claim. Well of course CO2 is the most abundant "green house" gas in the atmosphere... every living, breathing animal on this planet expels CO2. And why is CO2 a "green house" gas? Maybe because plants need CO2 to live." Wrong again. CO2 is not the most abundant green house gas, water vapor is. The reason CO2 is a green house gas is because it absorbs and re-emits IR radiation. The rest of your statement above is so incredibly pathetic it is embarrassing just having to read it. By the way do you just keep posting the same lame stuff over and over again because you think it sounds so good? We have had this same discussion back in October of 2010 quote: Originally posted by stanman: "First it as Carbon-Monoxide being emitted from tailpipes. When they realized that the amount of CO being emitted from tailpipes was such a miniscule percentage of the overall CO present in the atmosphere and that the current levels were consistent with those from samples for eons past, they had to find a new boogie man. Enter Carbon-Dioxide! They jumped on CO2 because it makes up a large percentage of the atmosphere. Never mind that all life on earth basically depends on CO2! No, CO2 is bad!! Looks like they need a new boogie man now so they are moving on to N2O!?!?" And I responded on page 93 of this thread: "Ahhh yes, pretty much as I expected, people who don't or choose not to even try to understand, anything, ever. Closed minded doesn't even begin to describe many around here. I don't see anyone here trying to provide sources of creditable information that disputes the specifics of either of the two abstracts I posted. Or even ask to see the whole article for that matter. Again these are from the most prestigious hard science journal on the planet. Guys you make it very hard for me not to use offensive language to describe your apparent diminished mental capacities, with regard to the actual use of reason. Ok, so Greg, where and when was it ever published that "Carbon Monoxide" coming out of tail pipes was ever the be all end all of the greenhouse effect? Particularly given the fact that water vapor and CO2 have been considered the two primary Green House Gases (GHGs) since they were discovered as the prime drivers of the Greenhouse effect by Joseph Fourier around 1825. That name ring a bell with you Greg? The greenhouse effect was experimentally confirmed by John Tyndall in the 1860's and quantified by Svante Arrhenius in the late 1890's. Humans have known about this stuff for well over 100 years. Current science and in particular the abstract for the article I posted states water vapor accounts for roughly 50% of earth's greenhouse effect, cloud cover adds about another 25% and CO2 another 20%, and the rest is produced via the other GHGs, 03 (ozone), N20, CH4, CFCs and other aerosols. The point of the article is that water vapor is highly mobile entering and leaving the atmosphere very quickly via evaporation, condensation and precipitation. The other GHGs are not like this, once in the atmosphere they stay there, some for a damn long time, in the case of CO2 hundreds of years. CO2 being the GHG that causes most potent effect for the smallest change in amount. Think of CO2 as low voltage control circuit that controls a high power high voltage circuit. Change the CO2 control circuit one volt and you change the power circuit 100 volts. It's not as if CO2 is a bad thing in and of itself, but just like everything else only in moderation, sh1t if we didn't have, "SOME", in the atmosphere the damn planet would be nearly a solid frozen ball of ice, ever hear of something called "Snow Ball Earth"? Right now about 30 to 35 degrees "Celsius" of our average yearly surface temperature comes from CO2 modulated greenhouse effect. Take it, CO2, all out of our atmosphere and we would have a zone a few degrees north and south of the equator that would have an average yearly temperature of about 1 degree C, and might not, more or less, be permanently frozen. The point is, given our current point in time in the current interglacial period, we should have about a maximum of about 280 PPM (parts per million) CO2 in the atmosphere, we have got 390 PPM. Science has nearly 750,000 years of ice core data that says CO2 normally varies between 180 to 300 PPM. But yeah it's all a scientific hoax, just ask BS Billy he will tell you, one that has been going on for over a hundred or more years. Ps. Oops, CO2 does not make up a "large" percentage of the atmosphere as you seem to be saying in your little rant above, at this point, as I pointed out above there is about 390 PPM CO2 in the atmosphere, put another way that is roughly 0.3% of all the various species of atmospheric gases, hardly a large percentage in anyone's book. Gee wiz Greg I though you were smarter than that, guess not. N20 is a potent if minor player, as far as GHGs in the atmosphere, but has much larger effects with regard to bodies of water, i.e. hypoxic/anoxic dead lakes and dead zones in near offshore areas, all along the coast in the Gulf of Mexico and Eastern Seaboard areas. Apparently you didn't pick up on that little bit, but it's something new for you to rant about I suppose." From my point of view, as well as the view of most reasonable climate scientists, it appears that it is your narrative that is busted, and you who is unreasonable. Later Larry Sapere aude! "Put some jam on the bottom shelf where the little man can reach it." "The Truth", it's just another liberal conspiracy! | |||
|
| Powered by Social Strata | Page 1 ... 101 102 103 104 105 106 107 ... 207 |
| Please Wait. Your request is being processed... |
Politics and more Politics
 |
 |
 |
 |