 |
 |
 |
|
 |
 |
 |
 |
 |
 |
 |
 |
 |
 |
 |
 |
|
Go  | New  | Find  | Notify  | Tools  | Reply  |  |
DRR S/Pro |
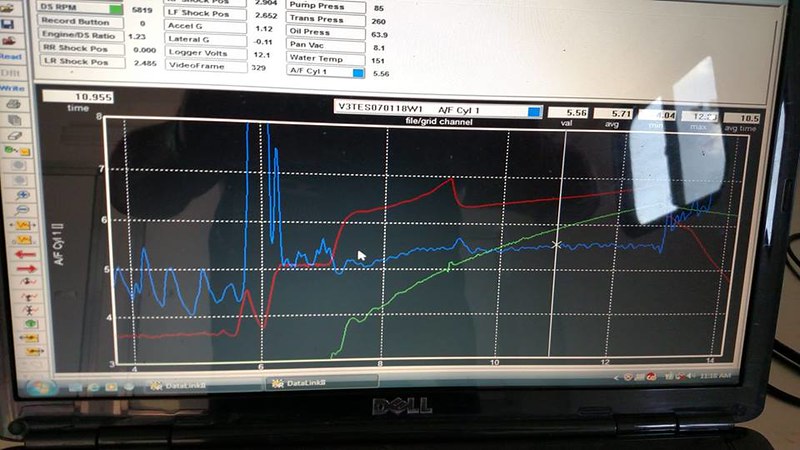
I agree with Ryan. It's the exact same curve; it just got a little bit later start due to the spin. Tony Leonard | |||
|
DRR Sportsman |
You can see the RPM drop when it spins at about 4 feet out.  This message has been edited. Last edited by: Malaby Racing, This message has been edited. Last edited by: Malaby Racing, | |||
|
| DRR Sportsman |
Went to MIR for the No Limit Race and made 10 hits on the TnT on Wednesday playing with shock settings and tires. Have no spikes, humps, nothing now. In the end, went up to 11 PSI out of the trailer and kept them around 11.4 when hot lapping, and set the Compression down to 2. Car was carrying the wheels perfectly. Thanks for all the replies. | |||
|
| DRR Sportsman |
My car creates the same blimps at launch and at shift change which is described below. Or it could be bumps in the track....read below: Link data to Gforces... Tire slip is indicated by the graph line being more vertical at a given point in the run where it should not be that steep, or by a sudden change upward anywhere in the run in the rate of the drive shaft RPM. One thing to look out for that can 4 throw you a curve is bumps in the track. If the car hit a bump that compresses the rear tires, the effective radius of the tire is reduced. Even though the car is still traveling at the same rate of speed, the driveshaft RPM will increase making the graph look like the tires have momentarily lost traction. A quick way to verify whether this is a bump in the track, or true tire spin, is to look at the acceleration G-force at the same point in the run. If the acceleration G-force does not decrease as the drive shaft RPM increases, it is unlikely that the tires have lost traction. A bump in the track is also characterized when the graph line makes a quick return to its normal shape (just a sharp hump in the graph), whereas with true tire slip the graph line is not as likely to recover quite as fast. It will take a number of runs for you to create yourself a database of what your drive shaft RPM graph should look like, but eventually everyone develops a graph curve that they try to achieve. This is usually based off of the drive shaft graph from your quickest run to date. By using your quickest run as a reference, and overlaying the driveshaft graph from your most recent run, you can visually see where the tires are accelerating faster or slower, and where the tire speed is higher or lower at any point on the track. Overlaying drive shaft graphs from multiple runs in the same lane at the same track will also provide you with graphic evidence of where the bumps in that lane are located, and whether those bumps are causing your car to lose traction.  Configuration: 3350#, 582 C.I., 60 - 1.24 1/8 - 5.53@ 126MPH 1/4 - 8.73@ 159MPH  3700#+210lb driver, FULL interior, through mufflers, 10.5 tire. 60'-1.333 (IN 4000ft DA! Joisy Math excluded; 1.25sec using JOISY MATH.) 1/4 - 9.60@144MPH | |||
|
DRR Sportsman |
I have a little craziness going on to. I haven't spent much time with it yet though.  racepak1 by neetchracer, on Flickr racepak1 by neetchracer, on Flickr | |||
|
DRR Sportsman |
Mine only does this at one track. So you may want to test at the track you were having the issues at to see if it is really fixed. | |||
|
| Powered by Social Strata | Page 1 2 |
| Please Wait. Your request is being processed... |
|
 |
 |
 |
 |

